
































































Statistics South Africa’s June inflation number came in at 5.0%, up from 4.5% in May. Crucially for the South African Reserve Bank (SARB), this figure places early pressure on the new inflation-targeting range, and the SARB’s Monetary Policy Committee will be watching subsequent monthly releases closely. This seemingly benign change belies the important – and in some cases unusual – changes that have occurred in the nature and dynamics of price formation in the domestic economy.
Within the 5% headline number, though, food and beverage inflation is only at 1.6%. So the price of food and non-alcoholic beverages rose over the last month, but three times slower than headline inflation. We have become so accustomed to a food-inflation narrative in South Africa that talk of slowing food prices seems almost counterintuitive. Some food products have actually gone down in price. For example, the June release shows that food alone rose 1.4%, but processed food fell by 0.8%, cereal products by 1.5%, fruits and nuts by 10% and vegetables by 3.5%. A real low core-food-inflation story, which is good news. Perhaps less appreciated is that clothing inflation has also come down and contracted at 2.3% over the annualised monthly June 2025–26 period.
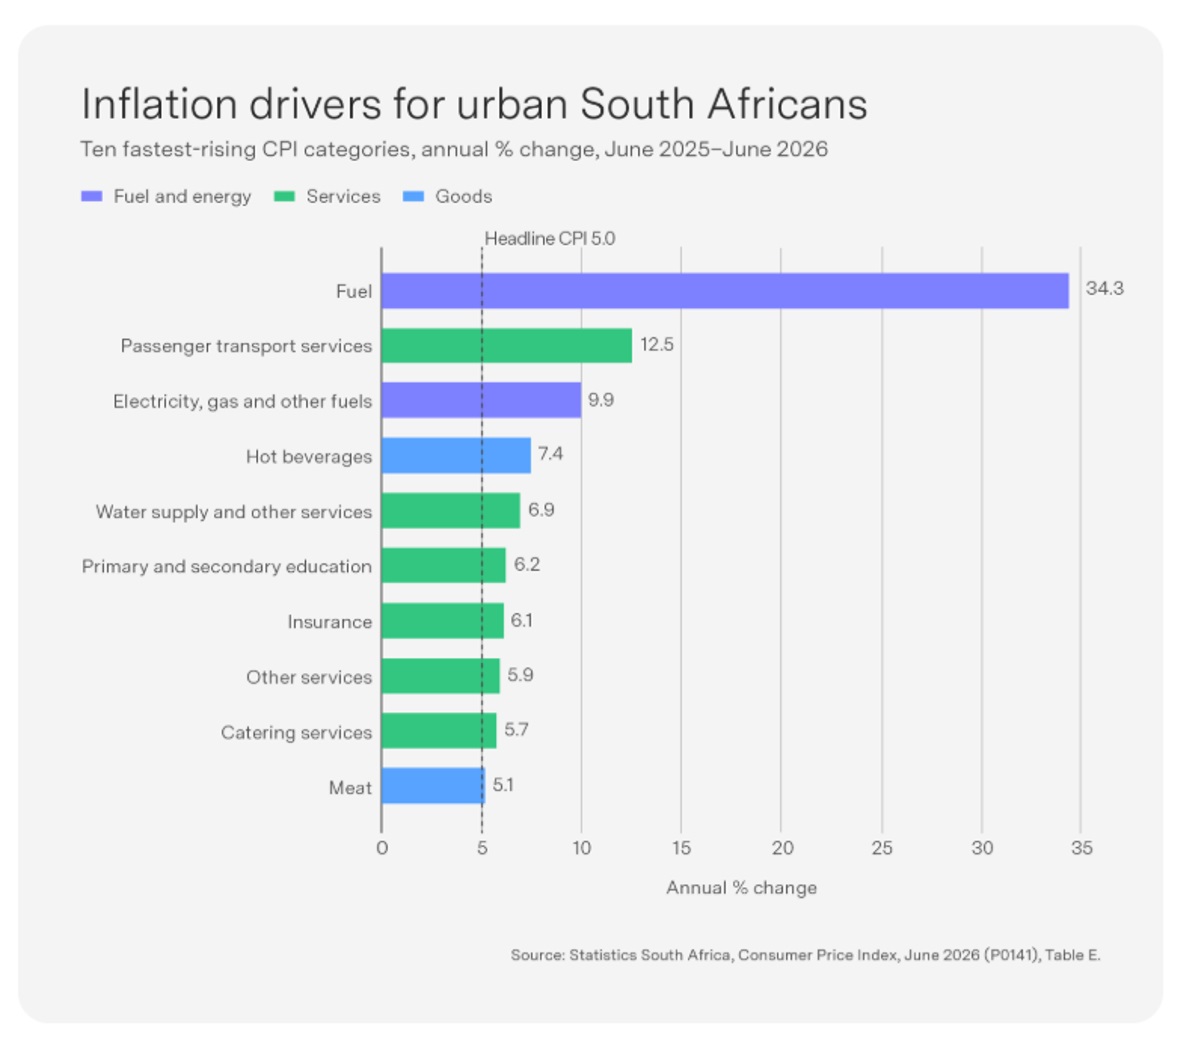
So what gives us this headline figure of 5%? The data offer some very strong clues. First, annualised CPI for the June 2024–25 period excluding administered prices was only 3.4%. Second, CPI for the same period excluding fuel was 3.8%, and third, the CPI is in at 4.9% (excluding housing). These numbers show the real drivers of inflation in this period, namely energy and water prices (administered prices), fuel and, to a lesser extent, housing. The graphic below confirms this, showing detailed product-level inflation drivers for urban households. Fuel inflation was a whopping 34%, leading to transport inflation of 12.5%, while energy and water inflation came in at 10% and 7% respectively.
Our inflation composition has thus shifted away from the traditional food and possibly fuel-based price effect to one more defined by energy and water. This is partly a legacy of load shedding and state capture, as households are paying for Eskom’s debt following a decade of plunder and mismanagement. This utilities inflation is also in part a function of water scarcity in a climate-changing world – and more recently a function of municipality mismanagement, which has resulted in a toxic debt-inflation relationship across a multitude of local governments around the country.
One worthy digression for stock pickers examining this new inflation dynamic in 2026 is that retailers in clothing, food and associated goods do not do well in this price environment. Low food and clothing inflation slows nominal revenue growth, while major costs – notably energy, water and fuel – have risen faster and squeezed margins. Unless retailers generate sufficiently strong volume growth, this cost mismatch compresses operating margins and makes earnings growth look weak.
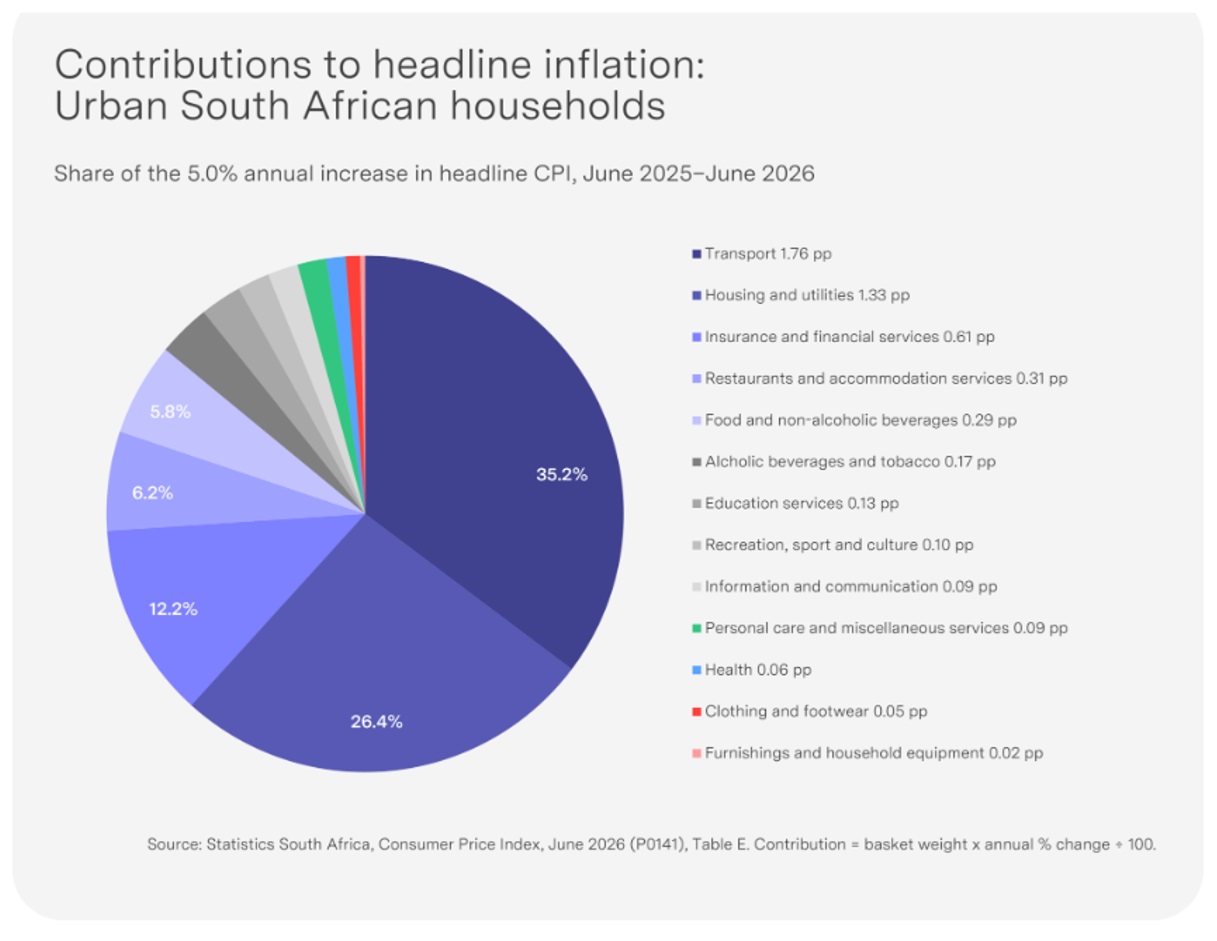
We cannot be certain whether these single product price increases are pervasive enough to raise general price levels in the economy. For example, a very high meat inflation rate would be interesting but not important to overall inflation in an economy where very few individuals consume meat. This is the domain of expenditure weights, that is, what share of the household budget accrues to a particular product or service. The evidence from the recent data suggest that inflation in this reporting period has become services-based. Transport, housing, utilities and financial and insurance services inflation accounts for close to 75% of the inflation experienced by urban South African households. If we include all services, total services inflation accounts for 90% of the average urban household experience of price increases. Due to the once-off fuel spike, transport may be worth excluding, leaving ‘pure services non-transport based inflation’ responsible for 55% of all urban domestic inflation. The average urban household is grappling more with price hikes in medical aid contributions, school fees and insurance fees than they are with food price hikes this year.
Richer households are generally well protected against all forms of inflation, but these figures suggest that middle class households are now experiencing a higher inflation rate than poorer households. I argued in a previously that poorer households experience higher inflation during food-price episodes, while middle-class households suffer during energy and housing price episodes. We are now clearly in the second regime, as services inflation is the driver (with fuel) of the aggregate CPI. Urban voters with government-rendered services (energy, water and education) whose prices have gone up may well have the perceived culprit of their hardships uppermost in their minds come the November elections.
While this signals the emergence of a services inflation model for South Africa, food as a driver of inflation is always just one drought or similar crisis event away. Urban middle class households have become predominantly services-based consumers, though, so I cautiously suggest that urban domestic inflation being predominantly services-driven – not goods-based – is here to stay. The challenge for the SARB remains how to navigate a services inflation dynamic while keeping an eye on wage settlements in the public sector for middle class union members that could create pressure on National Treasury’s 4% wage bill adjustment target. The policy lesson here is one I have made before: an inflation problem driven principally by administered prices and wage settlements is not a problem that interest rates can solve.
ENDS