


Bjorn Ladewig, Head of Distribution & Marketing, Just SA
Whether you’re using GPS, a map, or the stars, navigating any landscape begins with knowing where you are, where you want to go and what your perspective is. It also entails having some knowledge about the contours of that landscape. Is it flat, is it rocky, or a combination of both?
The same concepts apply when choosing a retirement income solution that will see you through the rest of your days.
In the 2024 Just Retirement Insights tracking study, respondents were asked how much they could afford to lose of their capital before their retirement plans were seriously impacted: 80% said they had a low capacity for loss.
They were also asked to rate the importance of several options regarding how they intended to use their retirement savings. While some rated leaving a legacy for their children as important, and others said supporting their partner was important, the option that topped the list was generating an income to pay their expenses for the rest of their lives. In other words, their income must be sustainable.
These are perspectives. The perspective of the capacity for loss, the perspective of the intended use of your savings, and the perspective of sustainability. There is also the perspective of certainty versus flexibility, with respondents rating certainty of income as their highest need and stating that they didn’t want their income to fluctuate with the ups and downs of investment markets.
They do, however, want it to keep pace with inflation.
Then there is the income perspective as expressed by drawdown rates. This is the amount of total capital you need to (or will be able to) draw down from your retirement capital each year, expressed as a percentage.
The Financial Sector Conduct Authority (FSCA) has draft conduct standards for default living annuities that recommend maximum drawdown rates based on age, as per the graph below.
Annuity rates are materially higher than safe drawdown rates, for the simple reason that life annuities can be priced on average life expectancy. Safe drawdown rates, on the other hand, must consider a longer time horizon (age 95 for men and 100 for females are typical) given there is a real chance of living to those ages and the longevity risk is self-insured.
Graph: Annuity rates versus age (males)
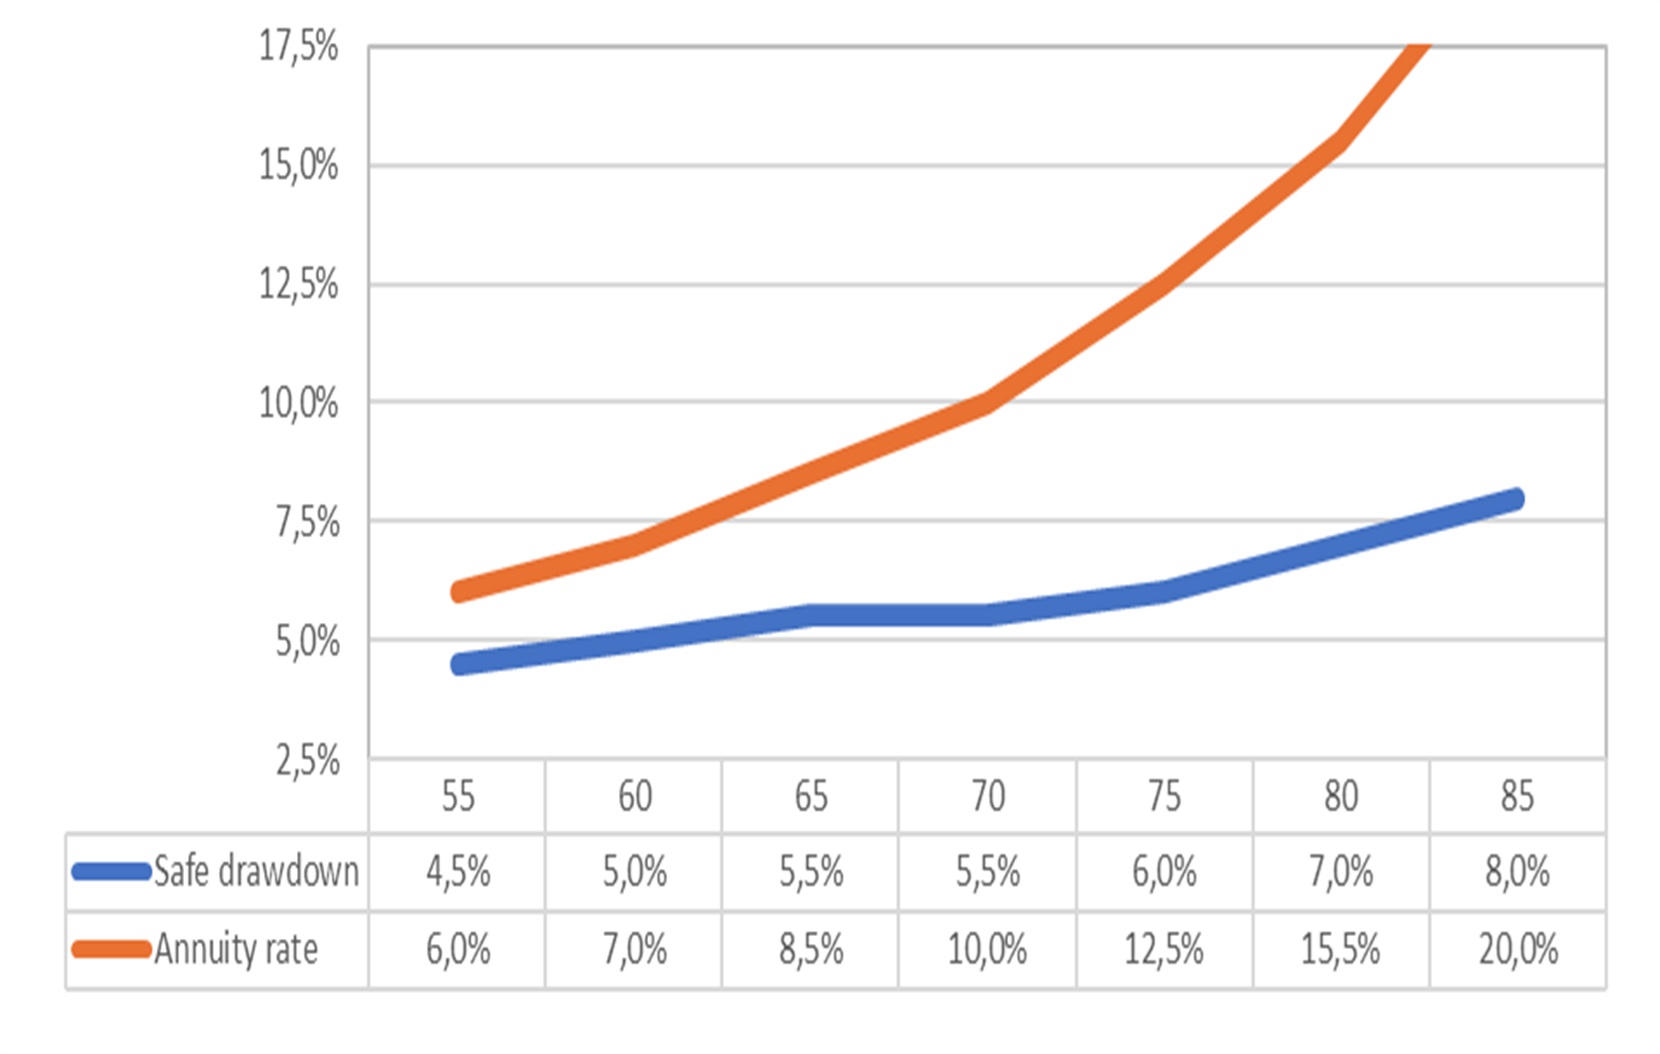
Source: FSCA draft conduct standards for default living annuities and Just SA
Mapping sustainability
Just SA has analysed more than 30,000 lives on behalf of its partners and clients and developed an overall sustainability map that plots drawdown rates against age. They then divided this into three zones:
- The safe zone – where individuals are drawing less than the FSCA’s safe drawdown rate.
- The risky zone – where people are drawing between the safe annuity rate for living annuities and the life annuity rate.
- The danger zone – where the drawdown rates are above even the guaranteed annuity rate.
For each of these zones there is an optimal retirement income product. Those in the safe zone can afford to invest in a pure living annuity with a high level of confidence that they will have a sustainable income for life. Those in the risky zone should consider a blend of living and life annuities; a strategy that can vastly improve the sustainability of their income at higher drawdown rates. Finally, those in the danger zone are best served by investing in a life annuity to mitigate the risk of running out of money.
Logic versus behaviour
Statistics from ASISA show that 65% of living annuitants draw down above 5%. Just research shows that 68% of living annuitants draw above their safe drawdown rate, and that the average drawdown rate is 8,5% across these lives, in other words not weighted by fund size. This means that about two thirds of living annuitants are drawing down at unsustainable rates, which can result in an average income shortfall of more than 15 years.
A solution that can help to alleviate financial stress in retirement is to invest in a with profit annuity, which is a form of guaranteed life annuity. With this product, annual increases are linked to the smoothed investment performance of, typically, a balanced fund. This results in a high level of protection against the impact of inflation on spending power, and thus less financial stress in your later years.
ENDS