


































































Philipp Wӧrz, Fund Manager at PSG Asset Management
Markets are always changing. We are not just talking about the daily market gyrations that tend to dominate headlines, nor even cyclical shifts between value, growth, momentum and quality. At a deeper level, there are also periods of change defined by shifting correlations between asset classes, the sectors that lead market growth and dominate indices, as well as market concentration. While the daily moves tend to command the most attention, the less visible, longer-term shifts are fundamental in shaping market structure and can have a substantial impact on the investor experience.
Day-to-day media commentary and investor attention are predominantly focused on the short-term changes. This is what drives the so-called tactical portfolio tilts, where asset allocations are tweaked to take advantage of shorter-term factors that impact the attractiveness of various asset classes. But the long term shifts can impact the returns from various sectors of the market for years to come, and ironically, they are often overlooked. When combined with recency bias – the tendency to weigh the importance of recent events more heavily – this can give rise to the dangerous perception that markets ‘just always behave this way’. This creates a sense of complacency that leads investors to position portfolios for an environment that may no longer exist – with potentially disastrous consequences for their financial wellbeing.
Example 1: Thinking US markets always dominate
The US market has dominated returns since the Global Financial Crisis (GFC) in 2008, but investors tend to forget that the preceding decade had been dominated by stocks in the rest-of-the-world. In addition, sectors had also changed leadership.
In early 2008, looking back on the preceding decade, an investor would have seen poor relative performance from US stocks, with the rise of China and other emerging markets top of mind. The materials, energy and real estate sectors dominated performance tables for the decade to 2008, while
communication services, information technology (still recovering from the bursting of the dotcom bubble) and healthcare lagged the rest. The dollar also struggled, with the US Dollar index declining by 40% from 2001 to reach an all-time low in March 2008. Unsurprisingly, the popular narrative at the time was to avoid the US and technology stocks and buy anything related to China and materials stocks, in particular.
However, looking back on returns since the onset of the GFC in March 2008 to today, tells an appreciably different story. Since March 2008, the US stock market has outperformed international markets by over 6% per annum with information technology and healthcare being the top performers, while previous high-flyers, materials and energy, have languished – nearly the mirror opposite of the experience from 1998 to 2008. The narrative around China has reversed abruptly, with the country being labelled as ‘uninvestable’ until a few years ago due to government interference in the corporate sectors, a troubled property sector, and a muted post-Covid-19 economic recovery that constrained economic growth.
Popular investment narrative: 2008 vs 2026

Today, US-focused indices, and especially tech-focused artificial intelligence (AI) companies, are dominating investors’ portfolios and passive indices even as the ‘US exceptionalism narrative’ may be running out of steam. Calendar year 2025 delivered the first indication that the US may not be invincible, with the MSCI All Country ex-USA Index delivering 33.1% vs 17.8% generated by the MSCI US Index.
Example 2: Thinking high levels of index concentration are new
In last week’s edition, Fund Manager Shaun le Roux went into some detail as to why a differentiated approach is called for when levels of index concentration are high. But it is worth pointing out again that we have seen high levels of index concentration before, and that it did not end well for investors who simply tracked the index. The TMT bubble of around the 2000s shows that indices reach extreme levels of concentration, often driven by capital expenditure (capex) bubbles. Vodafone’s market capitalisation peaked at approximately £260 billion/US$350 billion in March 2000, making it the single largest constituent of the FTSE 100 Index at around 13%. In 2000, an equity fund benchmarked against that index would have been under immense pressure to hold the index weight given Vodafone’s incredible price performance, but in reality the FTSE 100 Index was carrying significant idiosyncratic risk. Vodafone’s market cap today, some 25 years later, has declined by 89% from its March 2000 peak. This is in nominal terms.
Similarly, Nokia’s market capitalisation reached a peak of around US$270 billion on 19 June 2000. At its peak, Nokia’s weighting exceeded 70% of the HEX 25 Index, given the relatively small size of Finland’s market. More than 25 years later, Nokia’s market cap has dropped more than 85% in nominal
terms. This experience highlights that market concentration is not new, but also that those that unthinkingly replicate indices, may inadvertently take on more risk than they realise. Read our original analysis on the pitfalls of indexation here.
Example 3: Thinking the US dollar is always strong
US dollar cycles have a profound impact on the asset classes that do well, with emerging markets (EMs), real assets and value stocks all tending to do well during periods of dollar weakness and conversely being punished during periods of dollar strength. Historically, for EMs, a weaker greenback has alleviated the debt burden of loans denominated in US dollars and boosted demand for commodities. But what should also not be forgotten, is that a weaker dollar adds to the attractiveness of rest-of-the-world assets, as the double-whammy ‘strong dollar strong US market’ effect loses its potency. Reversing asset class flows can also impact returns, much as the world’s predilection for US companies has served to inflate the prices of US assets. Importantly, these dollar cycles can last for several years, meaning that if investors miss the change in cycle, their portfolios can be calibrated for an environment that no longer exists and suffer for several years as a result.

Example 4: Bond yields are always inversely correlated to equities
We have written extensively on the danger of this trap (read more here). The cornerstone of the 60/40 portfolio was the safe-haven characteristic of the US long bond. In periods of falling risk assets, long dated US Treasuries (USTs) could be relied upon to deliver good returns, alleviating portfolio drawdowns. For example, in the GFC period, long duration USTs delivered returns of about 20% over a period when the S&P 500 Index lost more than 40%, whilst displaying a strong negative correlation. More recent experiences, like in 2022, saw the S&P 500 Index decline about 25% over about nine months and USTs collapse, declining by more than 30% over the same period. This had a devastating impact on multi-asset portfolios relying on long bonds for portfolio protection.
A broader perspective would have helped an investor understand that the starting valuations during the latter episode were very different and had a profound impact on investor outcomes. At the end of 2007, as the GFC gathered momentum, the US long bond had a nominal yield of 4.5% and a real yield of 2%. In contrast, at the start of 2022, the nominal yield was 1.9% and long bonds carried a deeply negative real yield (between -3% using CPI and -1% using 10-year Treasury inflation-protected securities (TIPS)).
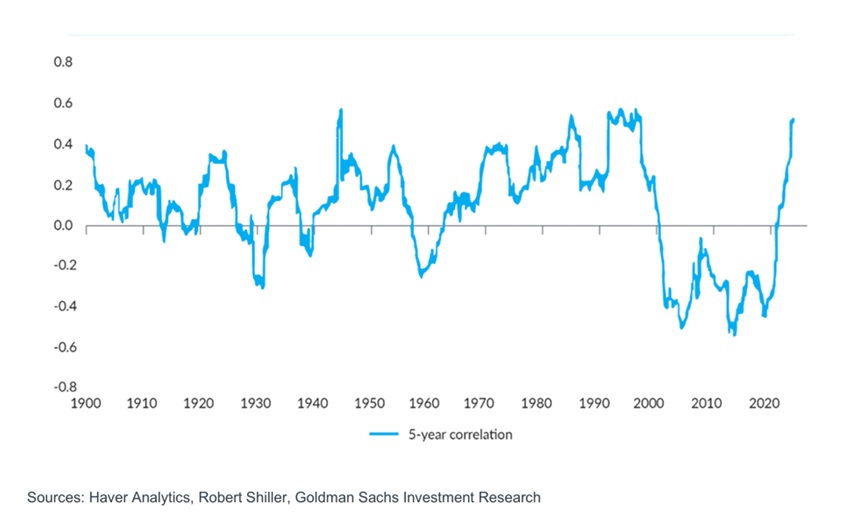
In addition, long-term data reveals that supply shocks to growth have a different impact compared to demand shocks, with much more uncertainty as a result in the monetary policy response and bond yields. The period of negative correlation over the past 20-odd years was not typical. In fact, 125 years of data (refer to the chart that follows) shows that long periods of positive correlation could be the norm.
Long-term data highlights bond & equity returns can be positively correlated for extended periods
S&P 500 vs US 10-year bond correlation – Daily returns where available, otherwise monthly returns
Investors remain complacent on the impact of long-cycle changes
The irony is that each of the ‘big’ cycles we have discussed so far, may be close to reaching an inflection point, or may already have done so. The US exceptionalism narrative, which has dragged indices higher, may well be running out of steam. After a bumper earnings season so far, markets are priced for perfection and expect earnings growth to continue well above trend. And as most price-sensitive investors appreciate, the initial price paid for an investment remains one of the best predictors of the investor experience to come. The implication is that many investor portfolios are poorly positioned for an environment that may look appreciably different to that of the past, with the potential to materially impact long-run investor outcomes.
So, what are investors to do?
If the past is likely to be a poor predictor of future success, and if history has shown that the top performers can reverse sharply from one decade to the next, what is the best way to approach this environment, and where are the opportunities likely to be found?
We believe that price-sensitive, bottom-up stock pickers are well-positioned to help investors make sense of a changing environment. Moreover, we aim to specifically consider the bigger picture and identify mispriced, quality assets that can be bought at a margin of safety, as we believe this tilts the odds of success in our clients’ favour in the long run. We believe an approach centred on independent thought and in-depth research will be crucial to achieve investment success in the environment that lies ahead.
Ed’s note: Meaningful diversification is the central theme of EBnet’s series, The Art of Manager Fusion. Watch it here.
ENDS