

































































Izak Odendaal, Investment Strategist at Old Mutual Wealth
When French Revolutionaries decided in 1793 that the calendar also needed radical change, the new months were named after typical seasonal weather. The part of November we find ourselves in was renamed Brumaire, or mist. It certainly feels a bit foggy on markets at the moment. Apart from the aftermath of the US mid-term elections, investors have had to contend with the CEO of arguably the world’s most important company getting into hot water, alongside renewed inflation worries. To cap it all, a global Microsoft outage, followed by the unrelated grounding of thousands of flights in the US remind us just how dependent the world is on a single piece of software. These chokepoints can be just as important to the global economy as the Strait of Hormuz. In South Africa, the skies may be sunny, but the outlook is also murky as we await local government coalition configurations and potential implications for national political stability. In short, it’s been a year of political, geopolitical and technological shocks. While global equities have held up reasonably well, it has been a particularly tough year for bonds, with more weakness last week (when bond prices fall, yields rise).
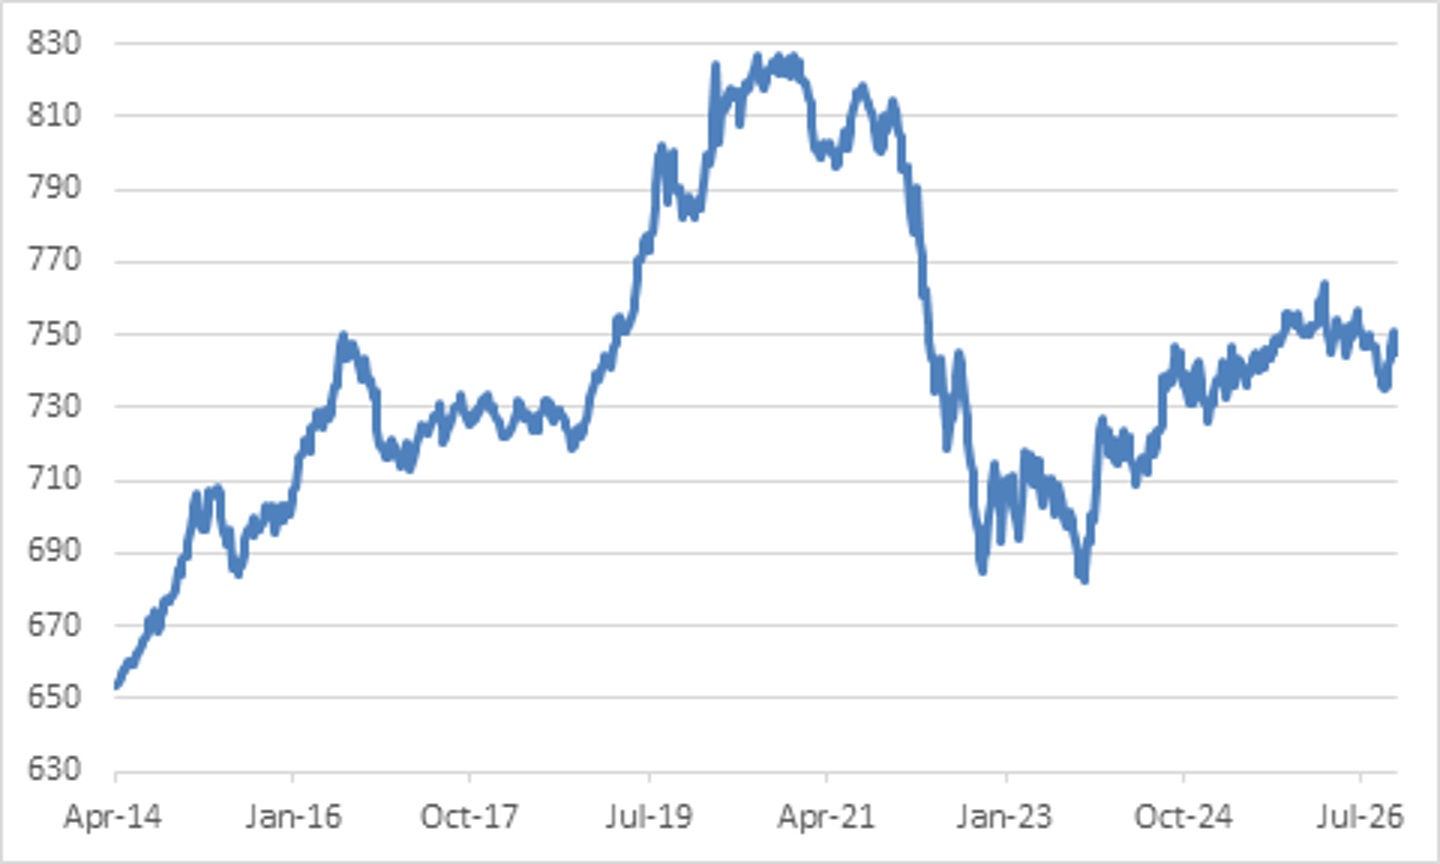
Chart 1: FTSE World Government Bond Index
Source: LSEG Datastream
As chart 1 shows, global bonds are negative this year after a few years of recovery from the 2022 rout. Bonds have been hit by higher inflation and interest rates, as well as resilient economic growth. Most recently, October’s US consumer inflation data surprised to the upside and makes a Federal Reserve rate increase in December more likely.
As the saying goes, when the US sneezes, the rest of the world catches a cold. In this case, higher expected Fed rates have put renewed upward pressure on bond yields across the world (which means downward pressure on bond prices). The dollar also strengthened, including against the rand, while gold prices pulled back. US inflation is proving sticky, and some further monetary tightening is warranted, but the market is possibly overreacting with the number of hikes now priced in. A big factor in upward inflationary pressures has been the oil price, and here the mid-term elections result suggests a gradual de-escalation of the Gulf War. The International Energy Agency noted last week that the global oil market is back in surplus for the first time since February. There is more than enough oil in the world, in other words, and the still-elevated price (50% higher than a year ago) reflects a risk premium that should compress if there is progress towards a ceasefire. As this happens, pressure on inflation and interest rates should ease.
Another factor putting upward pressure on US rates has been the AI capex boom. The combination of political pressure and a market repricing could slow the datacentre build-out next year. Moreover, while the dollar amount of spending will remain astronomical, the growth rate will slow simply because of the large base.
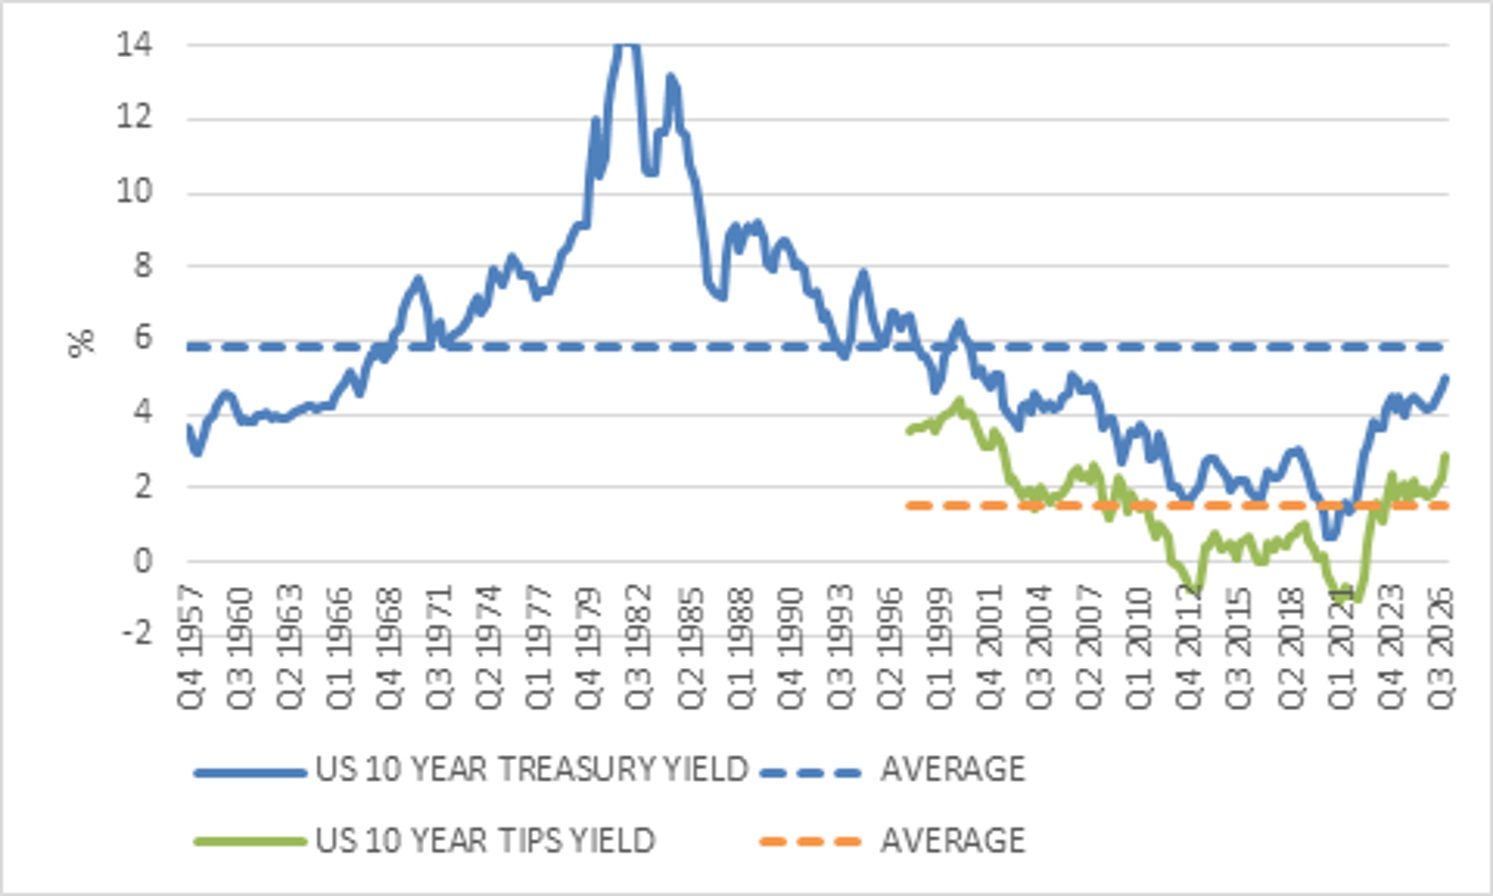
Finally, there is the longer-term backdrop of rising government debt. The question is whether there is sufficient compensation for risk. Clearly, as chart 2 shows, there was precious little compensation in the bond market for any of these risks until recently, but the situation has changed.
Chart 2 takes a longer-term look at bond yields in the US (the picture is similar in other developed markets). Three distinct periods stand out. The first was the 1970s, when interest rates shot up in response to double-digit inflation. From the early 1980s onwards, there was a relentless decline in yields as global inflation started falling, largely due to globalisation and technological progress. This caused a long bull market in bonds. The third notable period was in the wake of the 2008 global financial crisis. Bond yields fell sharply as central banks pinned interest rates near zero, engaged in quantitative easing. At the same time, the world economy was characterised by excess savings and insufficient demand. In some countries, yields turned negative, especially when the pandemic hit.
Chart 2: US bond yields
Source: LSEG Datastream
Today’s yields are not remarkable by historic standards, though it is worth noting that we’re probably in a different regime compared to the pre-Covid era. It is supply constrains that are biting while investment demand is quite strong. This points to a higher-for-longer rate environment, and no repeat of the long bull market in bonds.
The return of returns
Nonetheless, since starting yields are the best guide for future returns in fixed income markets, a US 10-year yield around 5% points to annual returns in a similar ballpark over the next decade. As long as one is not too pessimistic on the Fed achieving its 2% inflation target over time, it implies a decent real return of 2% to 3% in dollars. Academic studies (Dimson, Staunton and Marsh) show that the long-term (multi-decade) real return for US bonds is just below 2%.
Investors who are particularly nervous about inflation can consider inflation-linked bonds, or Treasury Inflation-Protected Securities (TIPS), as they are known in the US. These bonds currently promise an above-inflation dollar return of 2.6% if held to maturity. TIPS can be very volatile in the short term. These bonds have only been around since the late 1990s, but the current yield is above the long-term average. This is surely a very attractive option for American retirees who’ve made a lot of money in the booming stock market and now want to focus on generating an income.
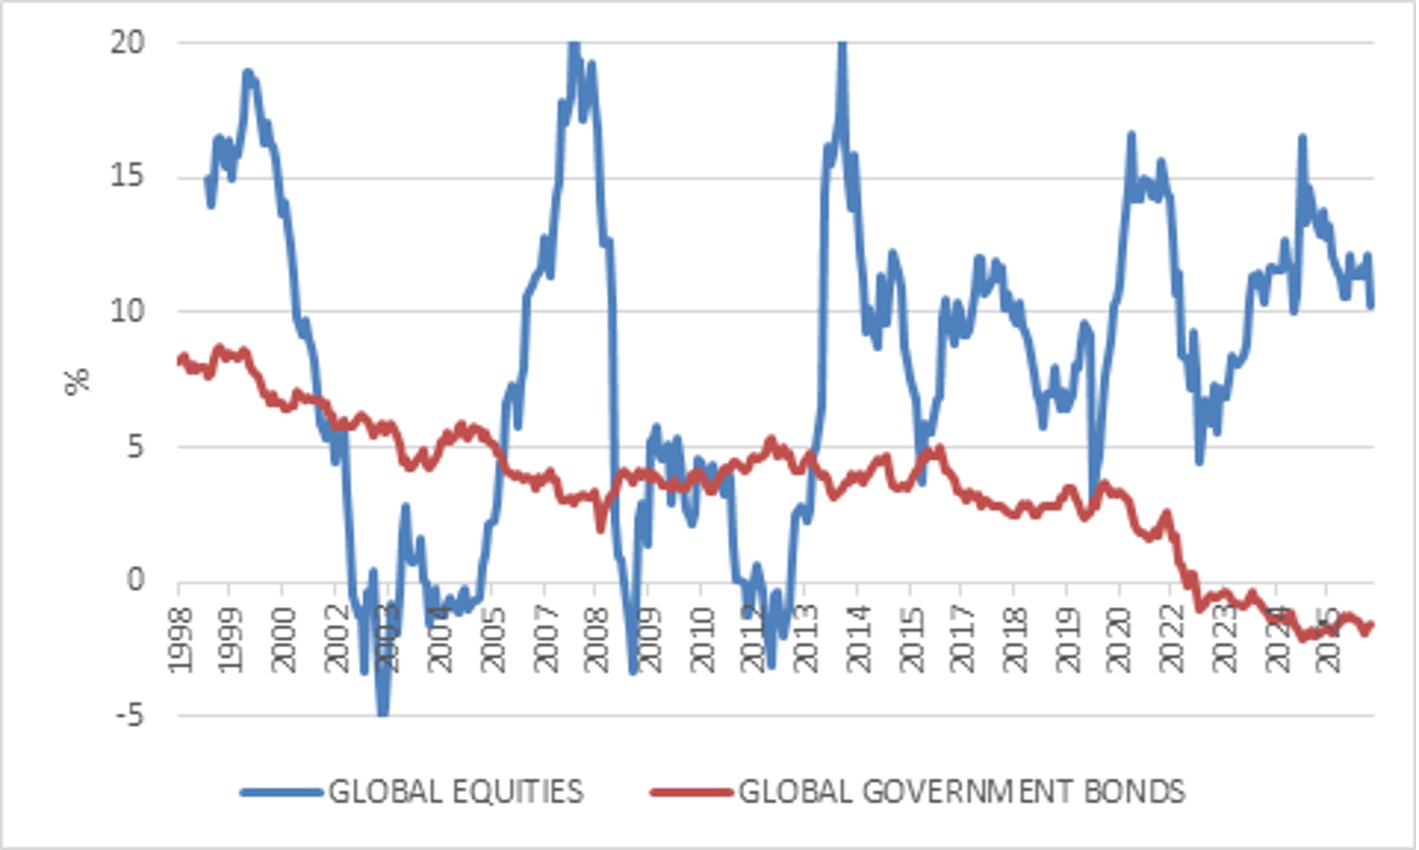
Chart 3: Rolling 5-year annual returns in dollars
Source: FTSE, LSEG Datastream
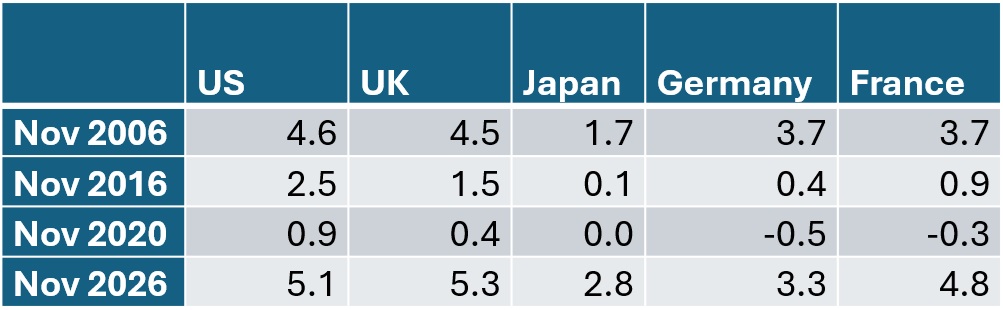
Chart 3 highlights the diversification benefits of bonds. In periods of sustained equity weakness (2002, 2008, 2012), bonds delivered a positive return. There is a glaring exception, however. When interest rates rose sharply in 2022, the bond and equity markets were clobbered equally. This has led many to argue that the traditional “60-40” diversified portfolio is dead. However, chart 2 and table 1 show the problem. Bond yields declined after the 2008 financial crisis and then fell to record lows during the Covid pandemic. There was only one way to go from there: higher. There was no margin of safety in bond valuations, whereas today, there is much more of a buffer.
Table 1: 10-year nominal government bond yields at selected points, %
Source: LSEG Datastream
Options for localsSouth African investors have long ignored international bonds. With restrictions on retirement funds’ international exposure under Regulation 28 of the Pension Funds Act, local investors have typically favoured global equities over bonds. This made sense when global equities were flying, global bond yields were very low, and domestic rates were high. The latter is still largely true, but global yields are now more attractive, as noted above. The updated Regulation 28 limits also means global bond allocations can increase without necessarily taking away from equities.
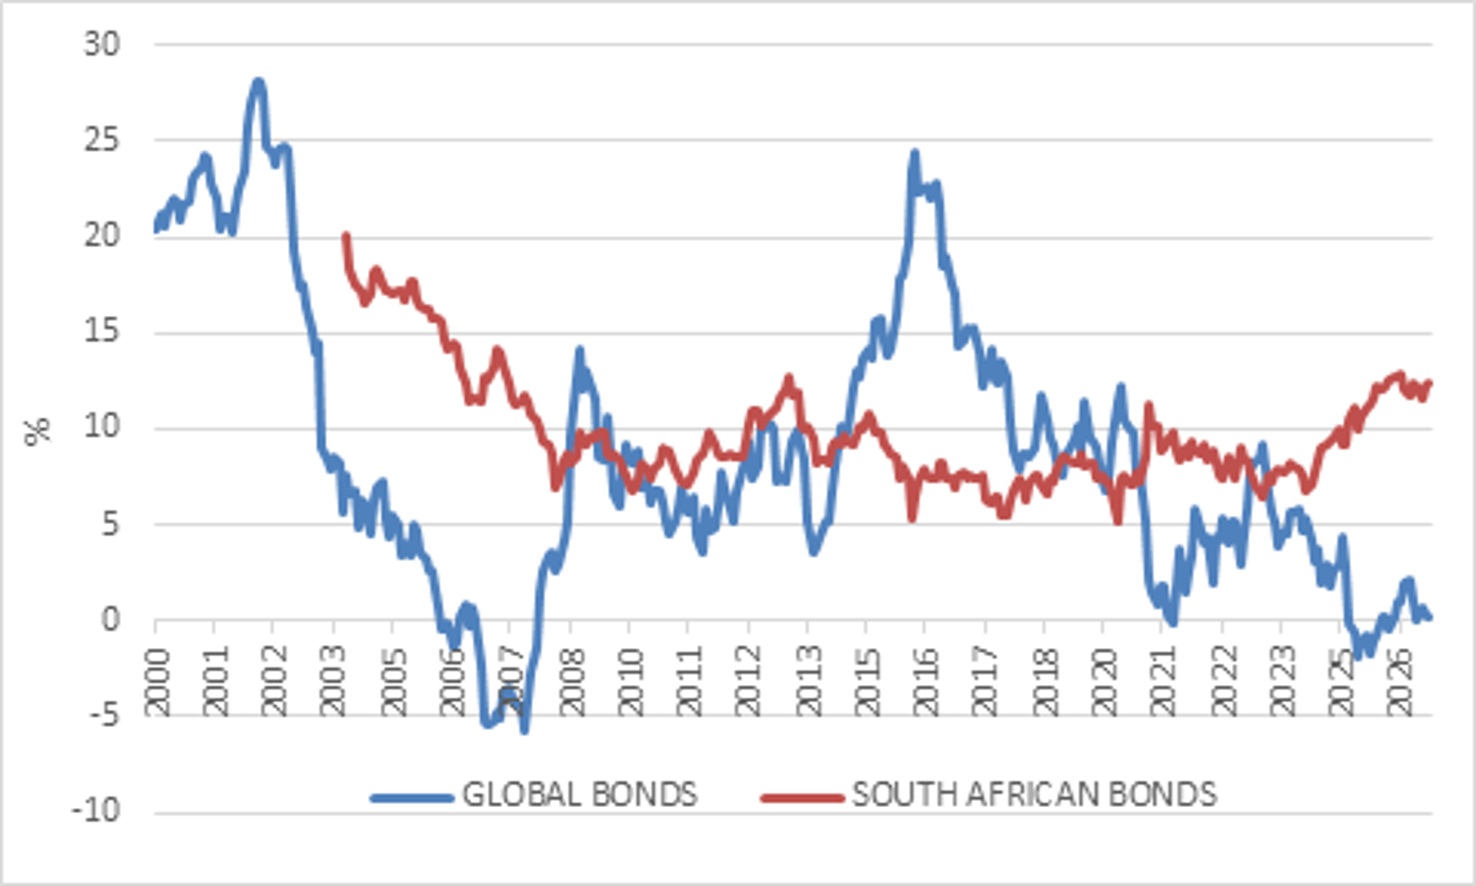
Chart 4: Rolling 5-year annual returns in rands
Source: FTSE, JSE, LSEG Datastream
There is still the matter of the rand. Short-term rand appreciation can easily wipe out short-term global bond returns, but as chart 3 shows, there are periods when local investors would’ve been very happy to own global bonds. The volatility relative to local bonds – largely due to exchange rate movements – means position-sizing should be carefully considered. The other option is to hedge out the currency impact.
Cross asset view
Looking across other asset classes, bonds also appear better priced compared to equities, specifically US equities. The equity market has been wobbly of late, including the 30% decline in the share price of Nvidia, since October. Before its decline, it was the world’s most valuable company, and at the centre of the datacentre build-out.
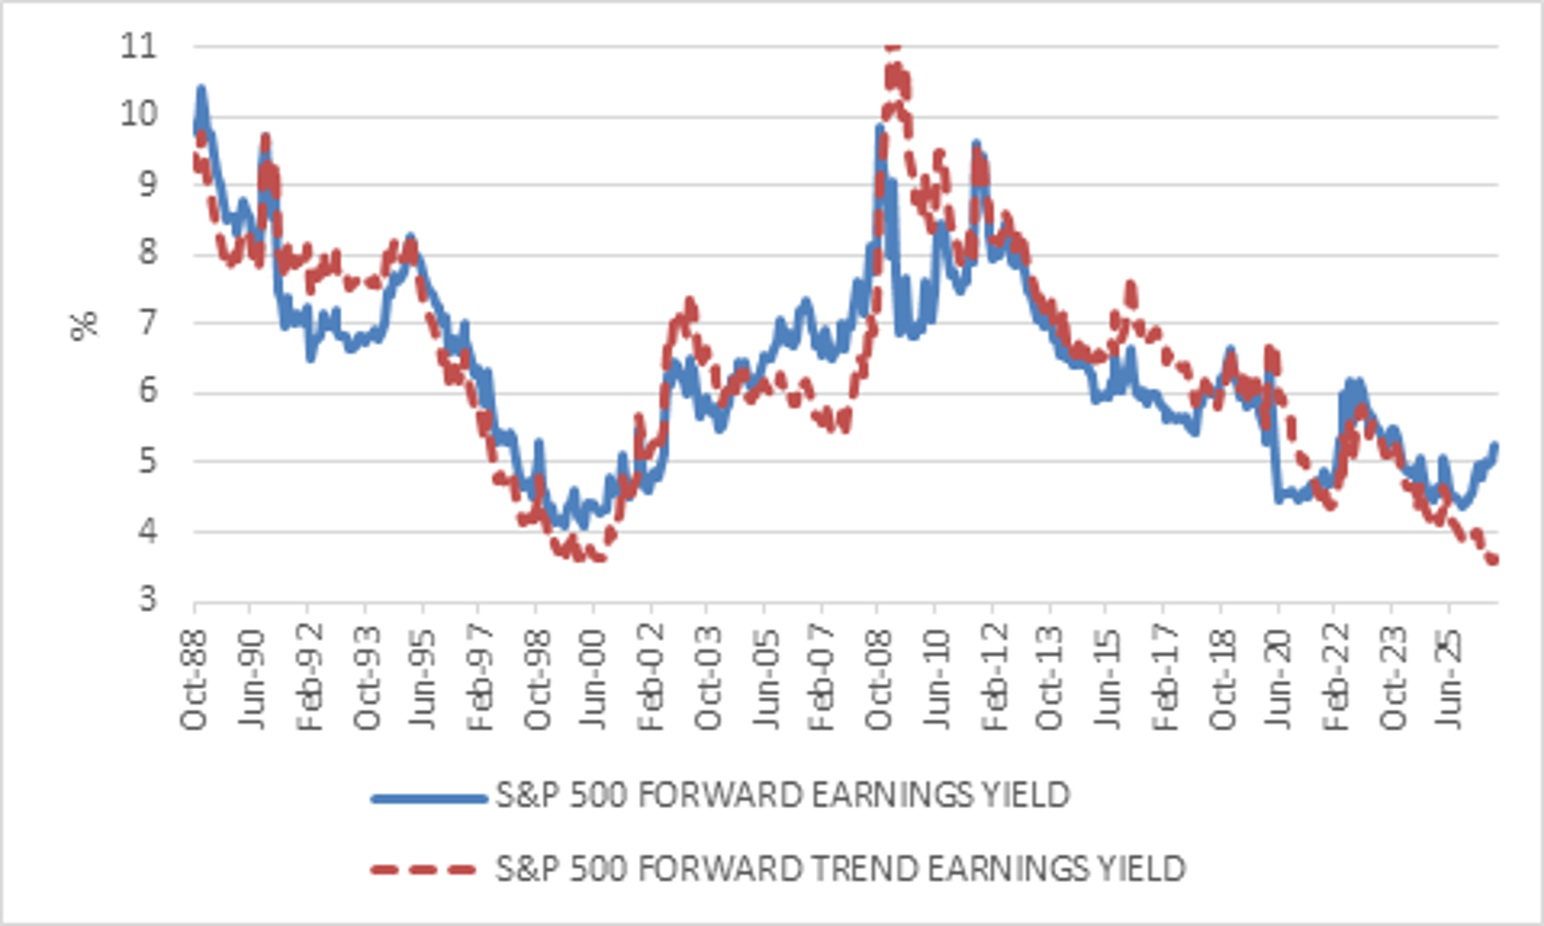
US equity earnings growth has been very strong, such that the price: earnings ratio has declined. The inverse of the price: earnings ratio is the earnings yield, shown in chart 5. However, the surge in earnings due to the AI capex boom is probably unsustainable. Comparing the current price to the long-term trend in earnings is a simple way of cutting through some of the noise around earnings (the dotted line). It shows the US market is trading at the lowest yield since 2000. In other words, if earnings revert to mean, the current market pricing points to pedestrian returns ahead.
Chart 5: US S&P 500 equity price: earnings ratios
Source: LSEG Datastream
Equities should still outperform bonds over the long-term, but the relative outperformance should narrow compared with recent years. The equity risk premium – how much more compensation investors get from equities compared to safer government bonds – is as low as it’s been this century, meaning that diversification has become more important. Outside the US, equity valuations are closer to average. (We’ll unpack this in future editions.)
In conclusion, it has been a perfect storm for government bonds in developed markets this year. Oil, inflation, rate hikes, and concerns over government borrowing have seen prices fall and yields rise. This means investors are demanding more compensation for the risks they are exposed to. It is unlikely that yields will decline back to levels seen between roughly 2010 and 2020, and the 35-year long bond bull market that started in the mid-1980s will not repeat. However, with yields now at the highest levels in almost 20 years (longer in the case of Japan), developed market bonds are back in business in terms of being able to contribute to a diversified portfolio.
ENDS